Here are a few preliminary findings from the data on the BBMP elections. I use publicly available data (2015 is here, and a big shout out to Thejesh GN who provided the 2010 data). Where possible, I use my fieldwork insights to buttress findings and arguments.

BJP flags at a polling ‘office’

A little boy in Congress paraphernalia
Story of the peripheries
First, both in 2010 and 2015, the probability of a BJP win increases as you move further away from the centre of the city (taken as the GPO – pin code 560001). This remains the case after controlling for the level of SC and ST population (they are not traditional bases of support for the BJP), Janaagraha’s ward quality scores (2010 and 2013), turnout and number of candidates. In the case of 2015, I also controlled for 2010 outcome and being in the same as the party in the Assembly for both 2010 and 2015. Preliminary regression analyses bear this out, though further robustness checks and perhaps better controls are required.
When one visualises the data on a map as KarthikS has shown so helpfully, it is not so apparent perhaps. The Congress has had some success in the peripheries, notably in the northwest and in the east. It also appears that the Congress has won the outermost wards. To be sure, I checked the relationship between probability of an INC win and distance from the GPO – it is a negative relationship. The BJP has also won a few seats in the South and the West, mainly in the Jayanagar, JP Nagar constituencies, considered as BJP strongholds.
These exceptions are interesting, and every ward has a story. But, there is a bigger picture. Why does the BJP appear to do better in the peripheries? I think there are a couple of reasons. First, the peripheries in Bangalore have large proportions of skilled professionals from all parts of India. The BJP has adopted, since 2014, various strategies and channels to engage with them. For instance, there are Facebook groups which communicate with these individuals. The BJP also held, at least in 2014 language-based events to cater to groups among these professionals. There remains some spillover effect from these.
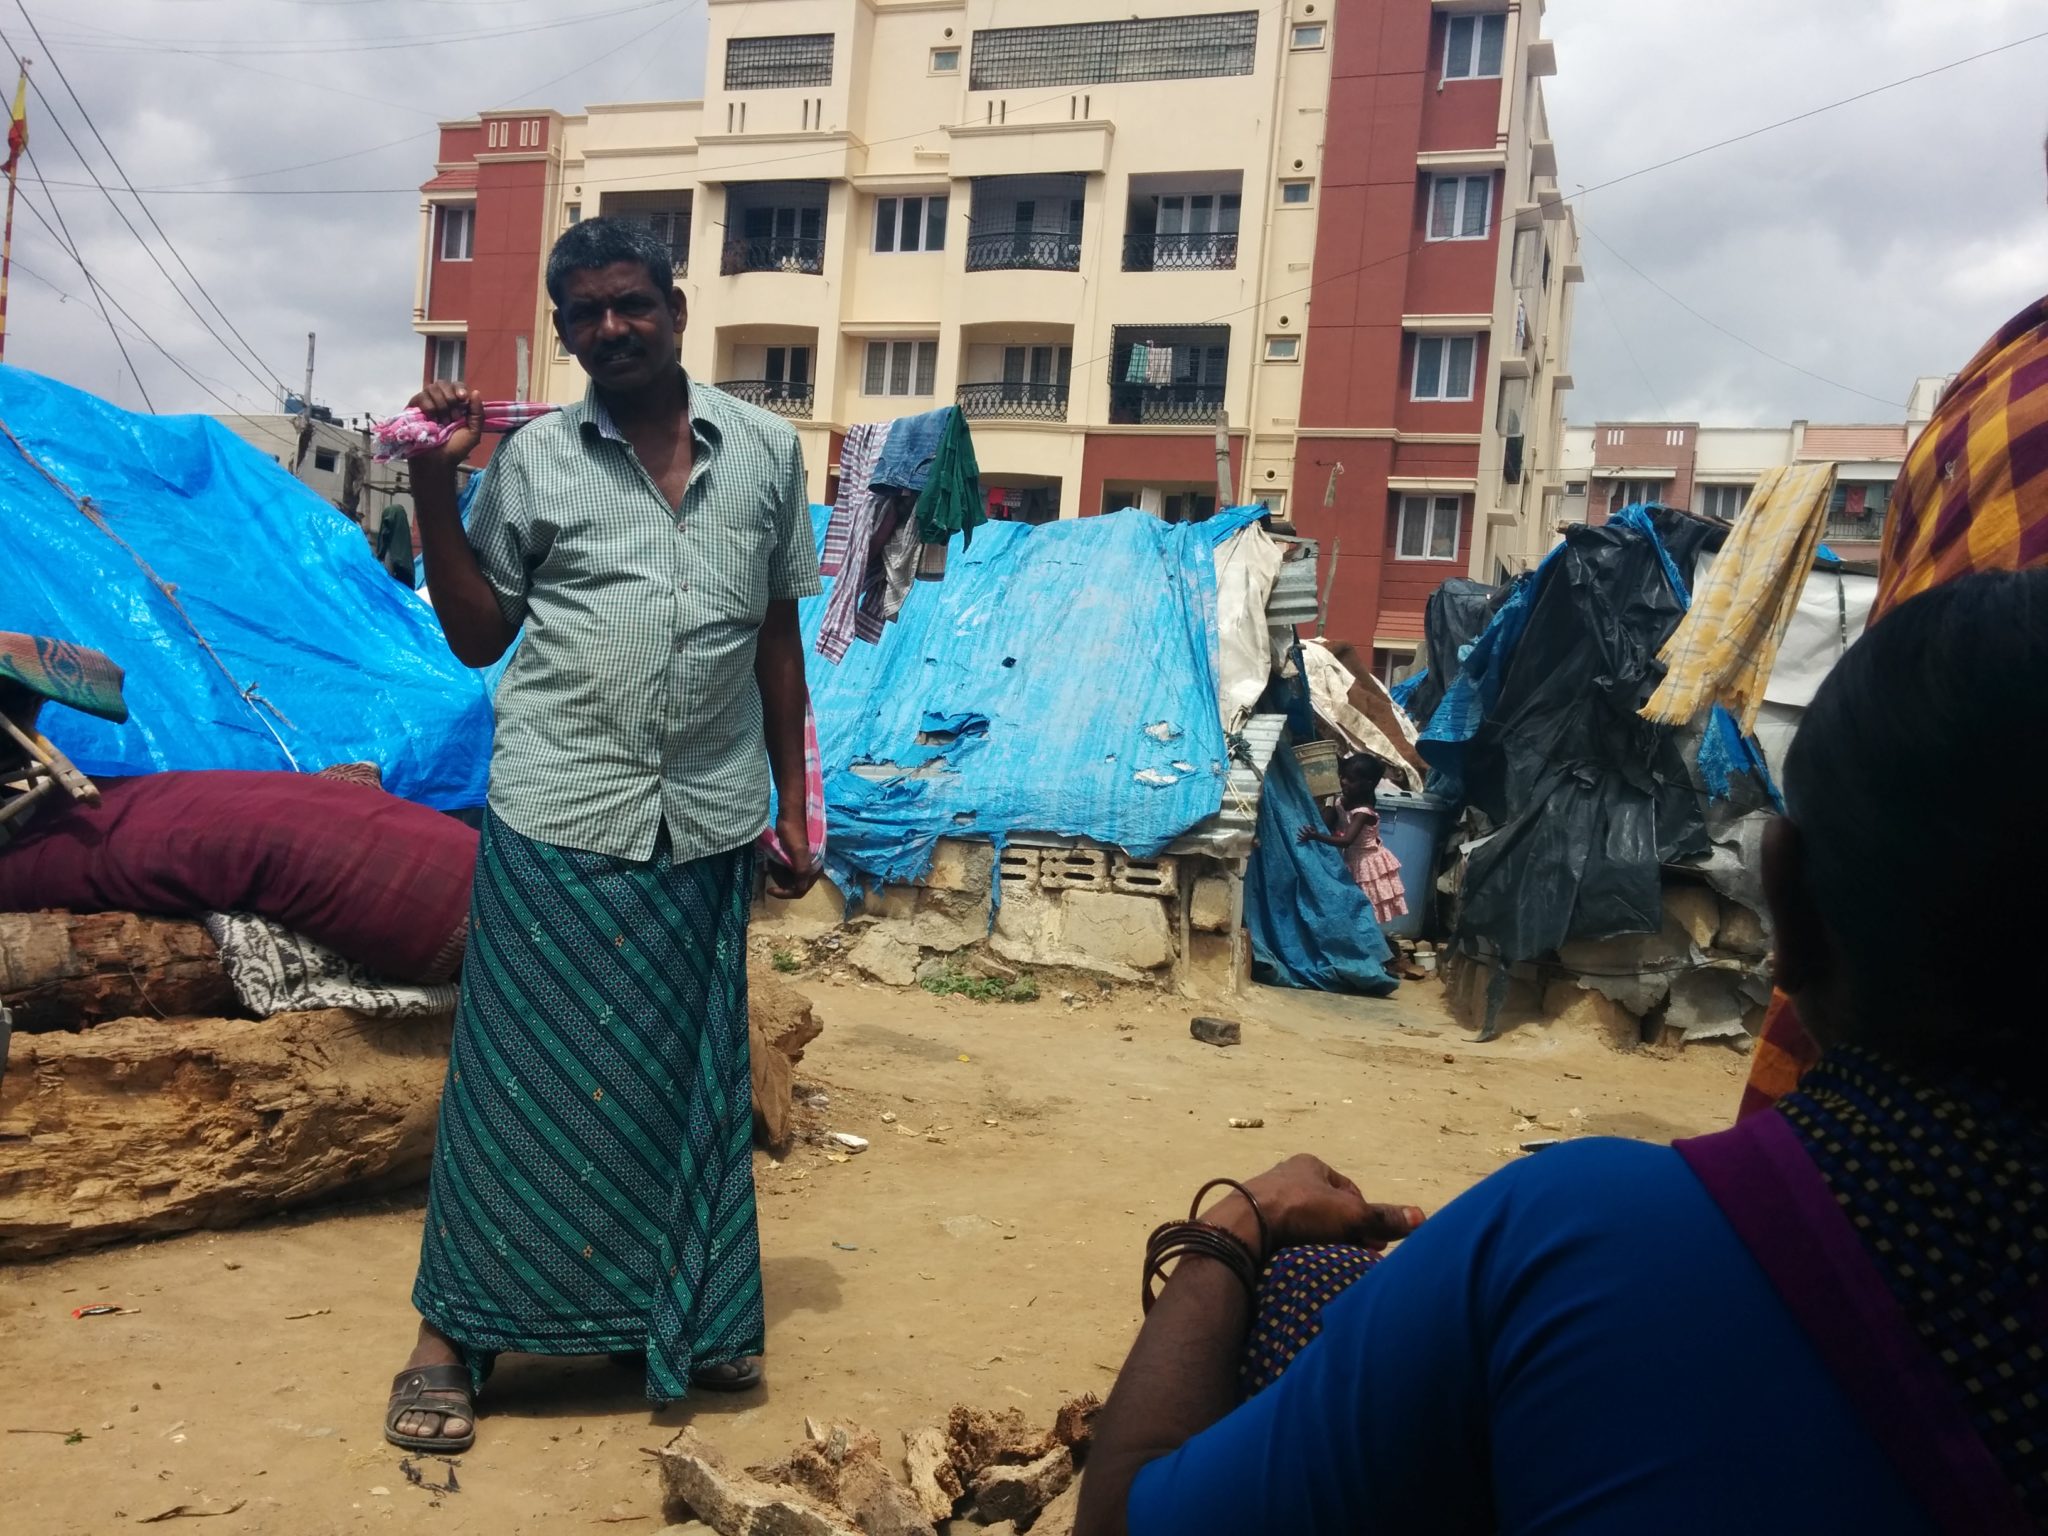
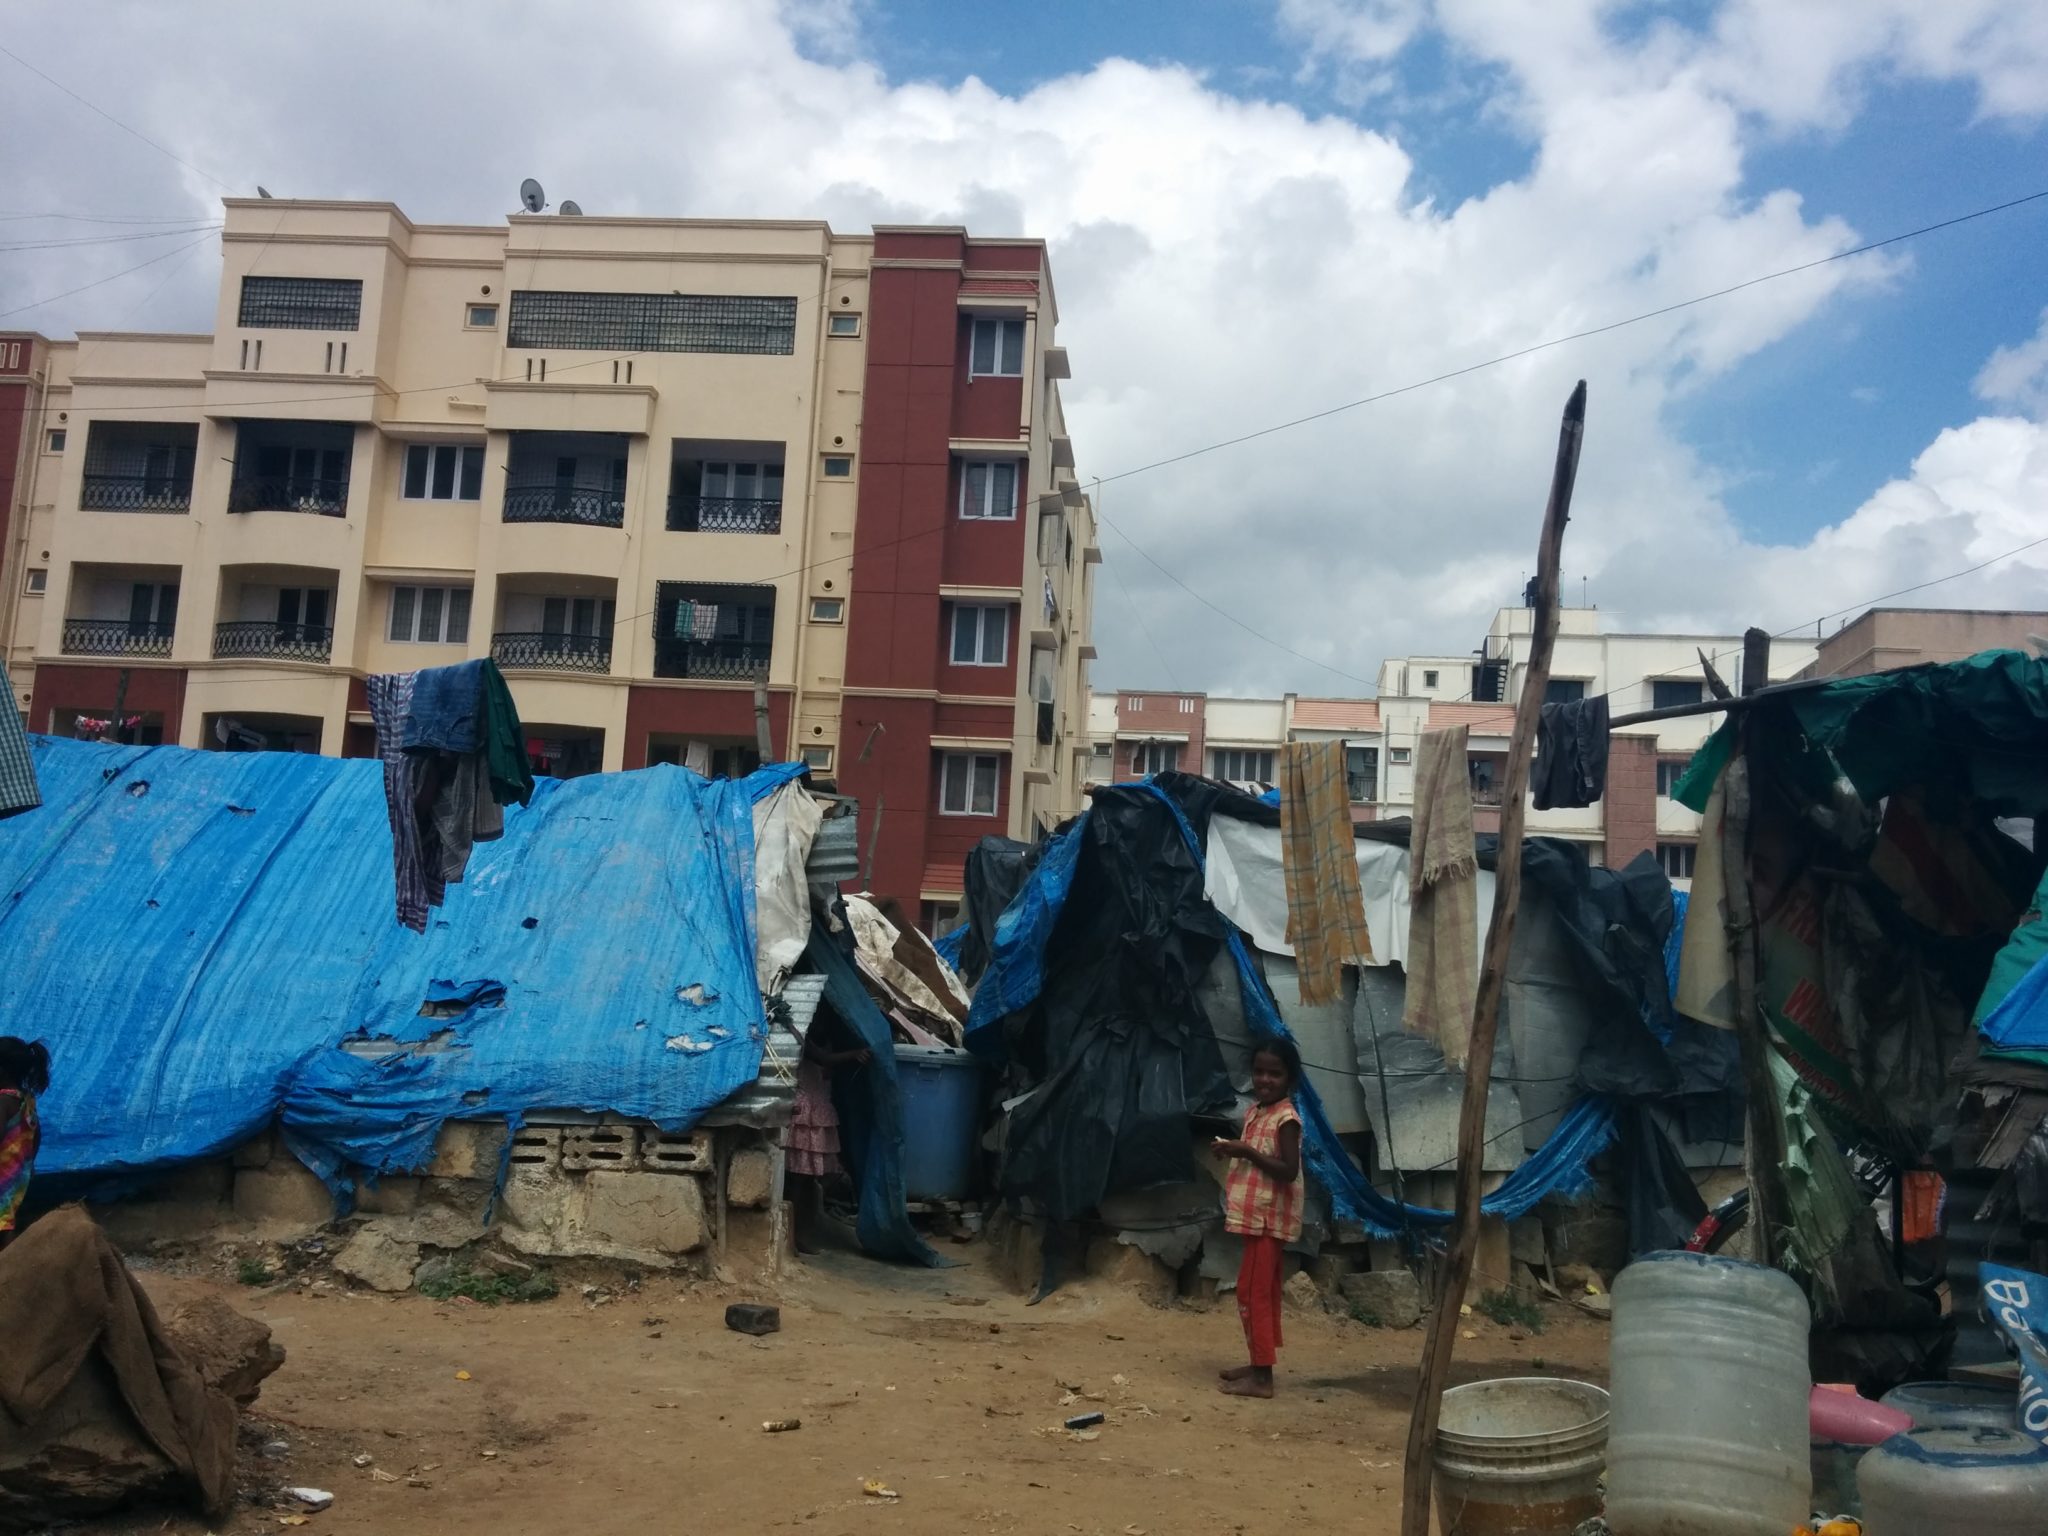
Second, local leaders’ orientation matter. Poor migrants who live in the outer peripheries frequently live in shadowy settlements. Their continued occupation of public land is tied up with being on favourable terms with petty politicians. The votes of residents on occupied land is almost entirely controlled by these local leaders’ party affiliations. The availability of booth-level data has facilitated monitoring, and residents feel compelled to vote for the party that these leaders recommend.
Now, this in itself does not tie up to any particular party affiliation, as there is constant churn among local leaders – in my field sites, I have encountered leaders who have stood in various elections from all the three major parties. Though it is hard to statistically verify these, I find that these leaders are frequently oriented to the BJP. This may also explain their strengths in the peripheries.
Housing and the elections
I studied the relationship between the number of unauthorised households* and the probability of a BJP win in the regression context above. In 2010, the probability of a BJP win decreased with increases in the number of unauthorised slum households. In 2015, this increased. Needless to say, this needs to be verified further (something I am up to over the next few weeks) but the change is noteworthy.
Why/how did this happen? Affiliates of the BJP such as the RSS and other Sangh organisations have continued their social service in slums of the city. These movements are avowedly apolitical, but in the 2014 elections several such organisations campaigned actively for the BJP. This good work has probably acted as a foundation, and continued efforts by these organisations have helped. While they did not actively campaign this time around as far as I could see, it is not possible to dissociate them from the BJP, and a spillover effect remains.
Performance
Interestingly, very little has been written about the performance of the previous BBMP and its effect on the election*. Between 2010 and 2013 (the two years when Janaagraha conducted its ward level quality assessment), ward quality scores had actually declined. The decline was greater in the BJP wards than in the INC-led wards**. There was also the garbage crisis of 2014, which continues in many parts of the city until now. noticed in my fieldwork also the lack of emphasis on the performance of the BBMP. Informants regularly mentioned the failures of the Congress government in power in the state, or that the achche din weren’t here yet.
| Party | Average of change in WQS |
| BJP | -1.10 |
| INC | -1.04 |
The reasons are multifold. FIrst, some others were probably just replicating their vote in 2014 in part due to fatigue – Bangalore voted in 2013 (Assembly) and 2014 (Parliamentary) elections as well. It was difficult for a new set of issues to emerge. Second, perhaps local elections are just a reflection of broader political trends. The emphasis on the performance (or lack of it) of the Congress at the state level to a large extent dominated the debate, where issues were discussed. Given that the BBMP has little power in important issues on housing and urban poverty, the evaluation was focused on the state government which is responsible for these.
Missing women: Gender
There are three dimensions to gender. First, the Election Commission statistics show that only 48% of the enrolled women voted, while 50% of the men voted. This meant that the overall difference was that ~208,000 more men cast their vote then women. There is a whole lot of interesting jugglery that is possible with those numbers about the value of a woman’s vote in comparison with a man, but the broader point is that about a 1000 women voters per ward did not cast their vote. Why?
Second, I find that in the 25 seats reserved for women in 2010 but not in 2015, the two major parties nominated ONE woman between them***. The nominated woman did not win. There were 3 women winners in the in wards not reserved for women, and they were lone candidates (all other candidates were men). Evidence from Bombay suggests that women are more likely to win in reserved constituencies – something that does not seem to bear out in Bangalore.
Third, I conducted my fieldwork in a reserved ward. I was there for 15 days prior to the election for half a day, sometimes all of it. I rarely saw the women candidates from the BJP and the Congress. Their husbands were at the forefront, greeting voters and managing everything. Even the one time that the INC candidate came, she stood several steps behind her husband and the man was introduced. Voters were told that the gentleman, Dhanraj (name changed) would take care of all their needs. I only saw and met the independent candidate. Of course, this may be because the campaign split up and the candidates were in other parts of the ward. However, the area I research in constituted more than 50% of the votes in that ward. Local leaders gleefully told me the women were ‘dummy’ candidates.
These aspects must give us pause. Of course, there is evidence in some states that the number of women voters is steadily increasing, a very different ‘silent revolution’ than Jaffrelot contemplated. During my fieldwork, many women I interviewed told me that they would listen to the patriarch. Yet, some others told me, as I left after the interview, that they would do what they pleased in the privacy of the voting booth. Thus, in the absence of insightful research into the dynamics of political decision-making within households, the silent revolution is likely to remain one of turnout and not participation. Next, the issue of women’s candidature and participation is something to consider. Even in a reserved ward, women candidates are ‘absent’. The consequences of such absence renders reservation policies nugatory and perhaps parties and civil society need to take steps to ensure that reservation translates into continued election of women into positions of power.
Conclusion
There are a few things to think about in the context of these findings. First, the geographical patterns in the outcome is noteworthy and warrants further investigations with more rigourous quantitative and qualitative work. My fieldwork suggests that there are differences in the local forms of mobilisation and political information flows in the centre versus the peripheries. This is perhaps more pronounced among poor voters in the centre versus the peripheries. Second, the causes for the seeming turnaround of the unauthorised households is also something that warrants more interrogation. What is happening on the ground? Are parties targeting voters differently; is it the youth? Next, the singular lack of emphasis on performance issues is noteworthy and troubling. In a city that is grappling with multiple issues, this disengagement and apathy is something to be discussed. Last, the gender dimension of participation must be discussed and debated further.
* The link to the Janaagraha website seems to be broken. I am currently away from home and unable to verify the proper interpretation of the WQS data.
** I have excluded JD(S) from this analysis. I also do not debate the components of the score or the process used to arrive at it.
*** I sorted these manually by scrutinising the name to determine gender. This has some weaknesses, and if someone has an updated list of gender, I would be grateful.